The Layout
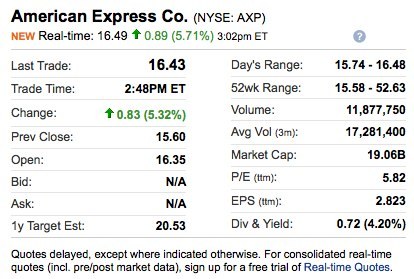
Stock quotes follow a similar format whether you’re using Yahoo! Finance (where the above stock quote came from) or you’ve gone old-school and picked up the morning paper: certain pieces of information are always included. At the top of the quote is the name of the company being traded — in this case, American Express — as well as the stock’s ticker symbol. Here, the ticker symbol reads “NYSE: AXP,” indicating that the stock, AXP, is traded on the New York Stock Exchange. There are quite a few stock exchanges that a stock could be traded on: major cities like Tokyo and London have their own exchanges, as do certain countries, like Australia and Switzerland. Wikipedia has a list of the major stock exchanges, along with in-depth information about each one. The numbers making up a stock quote are divided into two columns: the left-hand column focuses more on the basic facts while the right hand side reflects a little more analysis.
Last Trade
Whenever you want to know the current price of a stock, you want to know the last trade. This number reflects the last price that a single share of this particular stock sold at. It can change in an instant: it’s set by buyers and sellers trading the stock for whatever they think it’s worth right now.
Trade Time
Knowing the last trade price may not be so useful if that price is actually out of date. The trade time tells you whether you should really rely on that last trade price — it’s the time that last trade took place — or if you should go out and get an update. It’s common for a trade time to lag a few minutes behind your actual time, especially online.
Change
Change just indicates the difference between what the last trade price is and what the price before that was. I don’t find this a particularly useful indicator of a stock’s performance, as it only tells you what a stock did in the last two minutes and ignores the entire history of the company beyond that.
Prev. Close
Another limited indicator of a stock’s performance, the previous close is the price that the last share of stock sold yesterday (or the last day of trading) sold at. It’s only one sale in a 24-hour period, limiting how big of a picture it can provide you.
Open
The open is the price of the first share of stock sold today.
Bid & Ask
It’s common to see both the bid and ask sections of a stock quote blank, or listed as ‘N/A’. A bid is the highest price that a principle brokerage firm has announced it’s willing to pay for a share of a specific stock at a specific time. The ask is the opposite: it’s the lowest price that a firm has said it’s willing to sell a particular stock at.
1y Target Est
The one-year target estimate is an analyst’s projection of what the price for a single share of this stock one year from today. But because of all the variables in the market, these projections can vary extremely between analysts. I wouldn’t bet the house on a one-year target estimate.
Day’s Range
Starting the right-hand side of the stock quote is the day’s range. Rather than relying on a single share to give you an idea of what a stock is doing now, the day’s range gives you the range that a stock’s price has varied by over the course of the day.
52wk Range
The 52 week range is practically the same as the day’s range: it’s just the range of prices a stock has sold for over the course of the last year. In a volatile market like we’re in now, the day’s range can actually offer better information than the 52 week range because drops and rallies can make it harder to tell what a realistic range for a given stock looks like.
Volume
A stock’s volume reflects the total number of shares of that stock that have been traded throughout a single day. If a stock is particularly active, it’s worth checking into why: bad news could have lead investors to unload a particular stock, while good news could send every investor looking for a few shares.
Avg Vol (3m)
The average volume over the past three months of a stock is often fairly similar to the stock’s volume over the past day. Knowing the average volume can help you decide when the daily volume is active enough to warrant notice.
Market Cap
Market capitalization estimates the total dollar value of the company who’s stock is being traded. It’s determined by multiplying the total number of shares by the last trade.
P/E
Edited: The price to earnings ratio reflects the relationship between the price per share and the income earned per share by the company in which the shares are held. A higher P/E points to a more expensive stock, relatively speaking, because an investor pays more per unit of income.
EPS
Earnings per share is the amount of money that you would have earned if you purchased a share of this stock last quarter and sold it today. Right now, many stocks’ EPS are looking grim: it’s a useful indicator of how a stock will do if you plan to sell it in the short term, but if you’re planning to hold it long-term, the EPS is less of a concern.
Div & Yield
If you’re looking to turn a profit on stocks, the dividend and yield are probably the first places you look. The dividend is the payment the company pays to shareholders based on its profits. The yield is the dividend expressed as a percentage of the price per share. And while a high dividend is good, an extremely high yield definitely isn’t: extremely high yields can point to a company in some financial trouble.